|
|
||
|
Introduction A texture atlas is a UV Space mapping of an entire model which is useful in implementing run-time optimizations, 3D paint systems, and a number of other interesting algorithms. The goal of this project was to be able to automatically unwrap an entire model into a texture or multiple textures, generating a texture atlas of the model. The process of generating a Texture Atlas consists of two phases:
The following sections describe how the project implemented these concepts. |
||
|
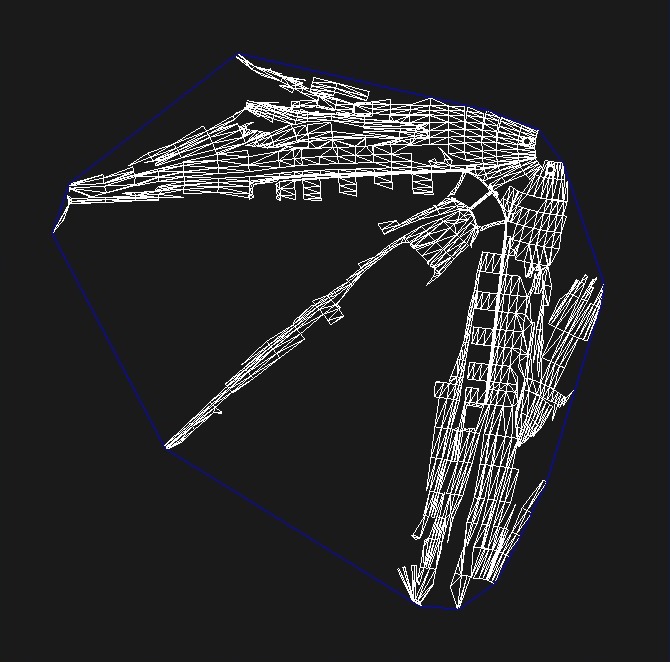
Unfolding The images to the right show various charts. Purple lines are bounding boxes and blue lines are convex hulls of the charts. The challenge to this stage is building as few charts as possible using as many faces as possible, while maintaining high density charts. The images to the right illustrate that some charts have quite a bit of dead/unused space. Phase 2 of the project will address optimization of the charts to minimize this.
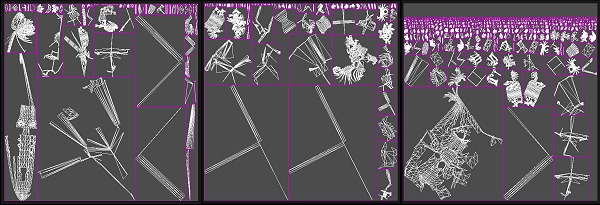
Packing The first algorithm developed for packing was a simple algorithm where it would incrementally work across the texture space adding the next smallest chart. If it didn't fit, we would proceed to the next line where it was guaranteed to fit. Each row would alternate between packing them in left-to-right order. and packing them in right-to-left order. This allows a bit better compression, which was the next step. It compressed the packing by sliding the newly placed chart down until it would intersect the charts below it, then backed it off. This helped optimize some of the utilization of space. The 3rd image on the right illustrates the packing for a helicopter model. It packed it fairly well but it wasn't able to use as much of the space as we had hoped. Notice how the upper right corner is empty. To fix these problems, a different packing algorithm was developed. The new algorithm keeps a skyline of the bounding boxes of currently packed charts. It is quickly able to find the best span in the skyline that would fit the next chart to be added. In the 4th picture, it can be seen that the same helicopter model now packs much nicer. In that image, the current skyline is drawn in green. The skyline technique is extremely fast.
|
(1st Packing Algorithm). 
(Improved Packing Algorithm). |
|
|
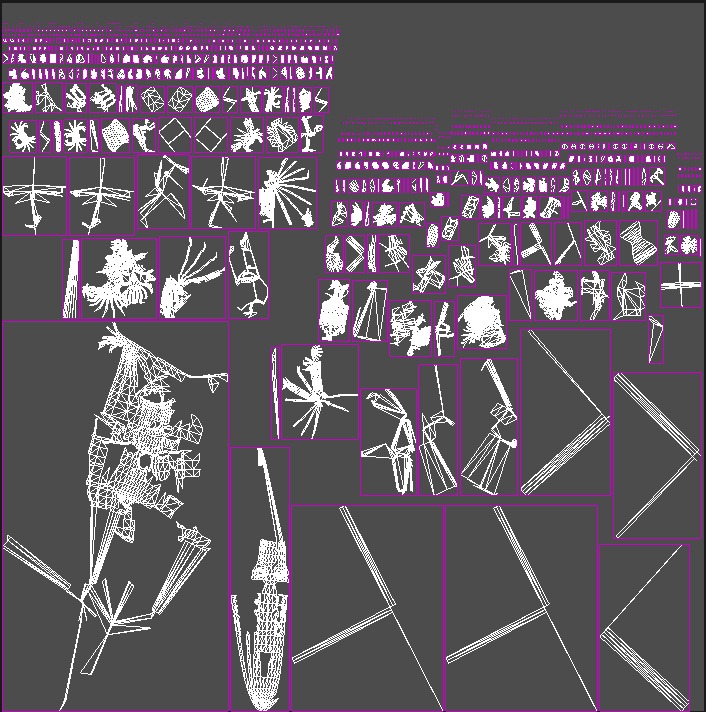
Packing Multiple Textures The skyline algorithm used for packing works well and makes it easy to support packing an atlas into multiple textures. Packing into multiple textures allows keeping the maximum required texture size down to a reasonable level, in exchange for the cost of using multiple textures in your run-time. One challenge, however, arises with using multiple textures. When scaling the charts to fit into the texture space, some charts may scale larger than an individual texture. This situation arises because the algorithm keeps the scaling uniform for all charts. (This uniform scaling was a requirement imposed on the design, to keep the sampling rate of adjacent charts consistent.) In the first image below, it shows the helicopter atlas spread across three textures, but note the third texture is not efficiently used because the scaling of the charts was limited by that which was required to fit the first chart into the texture. To improve texture utilization, the packing algorithm has the ability to split charts that will cause these scenarios. By splitting the charts, it reduces the chart size, allowing for a better selection of scaling factor to maximum texture space utilization. The second image below illustrates the same atlas, but with chart splitting enabled.
|
||
  |
||
|
|
||
|
Phase 1 Conclusions The project was successful in achieving the goal of being able to unwrap any model into charts and pack them into textures. To be truly effective, it must better optimize charts to remove deadspace. Therefore phase 2 of the project will be to include work on these types of optimizations. They will take the form of either guiding metrics when creating charts or post chart creation optimizations. The final goals will be to reach a specific density metric for charts.
|
||
|
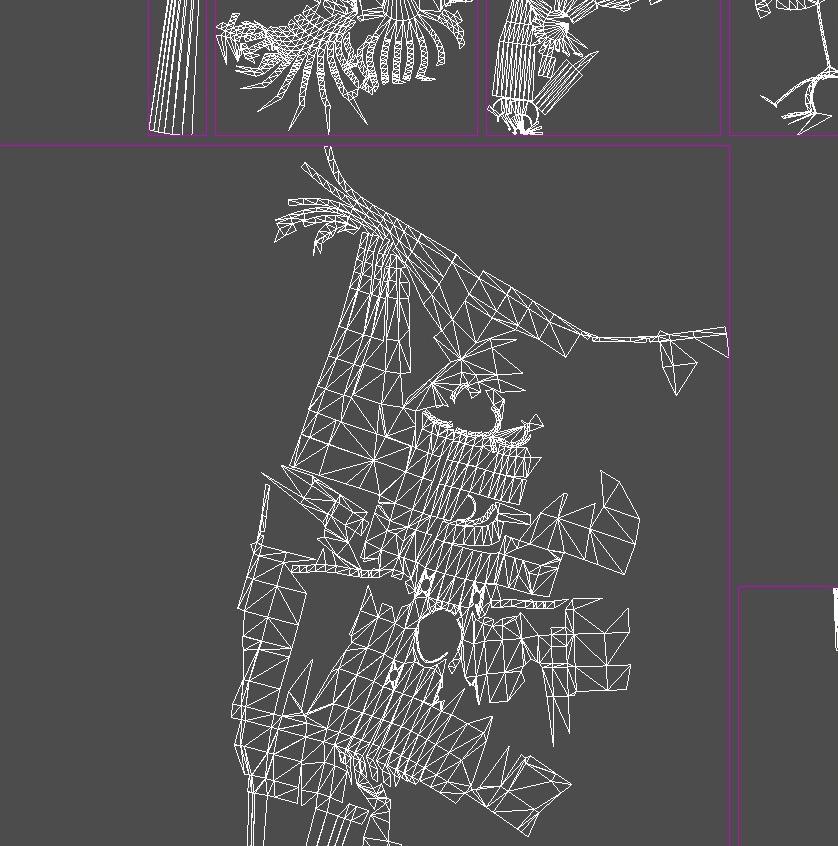
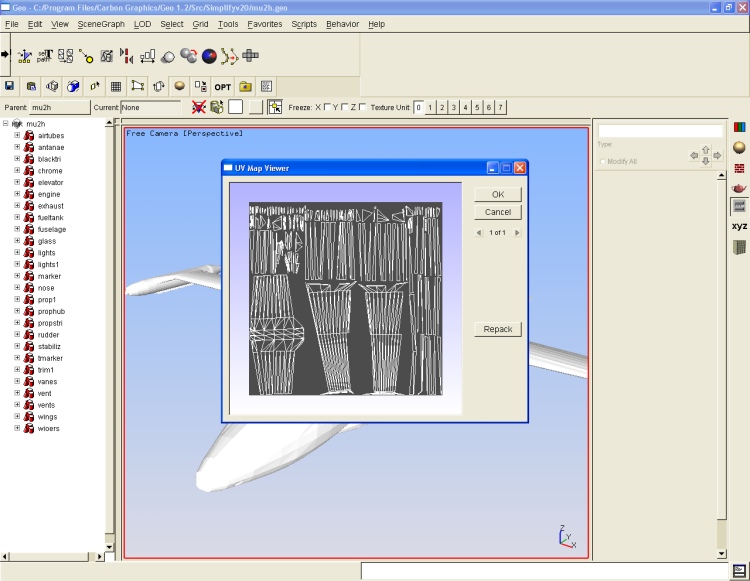
Phase 2: GEO Tool Phase 2 of the project involved developing a tool for Carbon Graphics GEO modeling tool that utilized the technology developed in Phase 1. Also included in Phase 2 was a bit more optimization technology. The tool allows specifying how many textures to use, the texel spacing between the charts, whether to build charts by model grouping or using the entire selection, and an angular parameter which stops chart building when subsequent faces would be more than n degrees away from the starting face. The tool displays the charts for each texture, allowing the user to view/approve them before accepting them.
The following images illustrate the tool in GEO: |
|
 |

|
|
Future plans for the tool include improving the layout optimizations, allowing charts to be different
scaling factors (so more important features can have more area in the texture), and to allow manual
adjustments associated with the automatic layout.
Stay tuned for more results from Phase 2 of the project. |
|
glenn@raudins.com